))
))
))
))
))
))
))
))
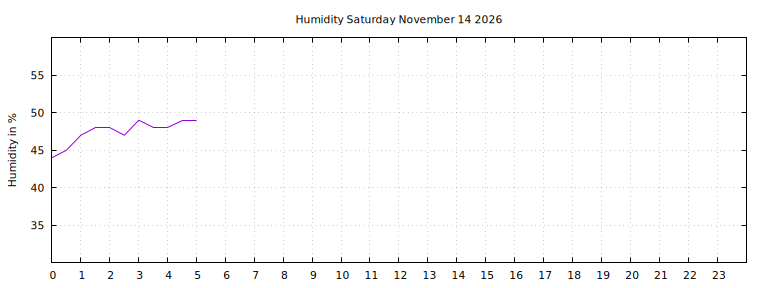
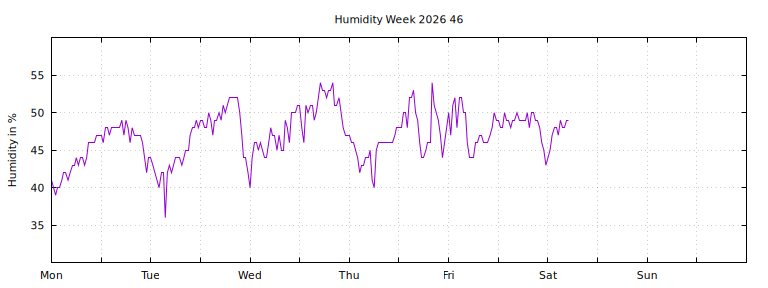
| Daily Statistics | |||||
| Day [+] | RHmin % | RHmax % | Mean % | σ | n |
| Saturday November 14th | 44.0 | 49.0 | 47.5 | 150% | 12 |
| Friday November 13th | 43.0 | 52.0 | 48.1 | 213% | 48 |
| Thursday November 12th | 40.0 | 54.0 | 46.6 | 296% | 48 |
| Wednesday November 11th | 40.0 | 54.0 | 48.6 | 316% | 48 |
| Tuesday November 10th | 36.0 | 52.0 | 46.4 | 381% | 48 |
| Weekly Statistics | |||||
| Week [+] | RHmin % | RHmax % | Mean % | σ | n |
| Week 46 (November 9th) | 36.0 | 54.0 | 47.0 | 322% | 252 |
| Week 45 (November 2nd) | 38.0 | 66.0 | 52.4 | 744% | 336 |
| Week 44 (October 27th) | 47.0 | 63.0 | 56.6 | 321% | 283 |
| Updated every 30:th minute. |
|
|
| Monthly Statistics | |||||
| Month [+] | RHmin % | RHmax % | Mean % | σ | n |
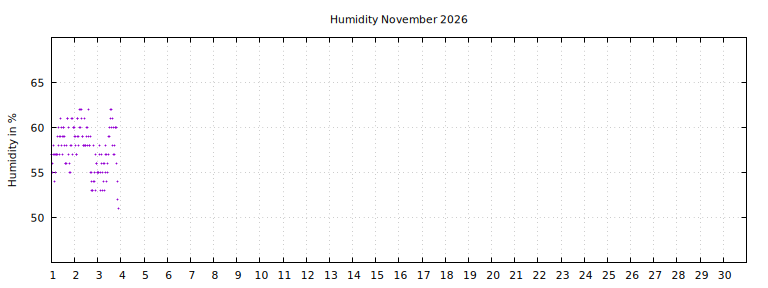
| November 2026 | 36.0 | 66.0 | 50.6 | 668% | 636 |
| October 2026 | 40.0 | 63.0 | 51.4 | 471% | 1243 |
| September 2026 | 40.0 | 53.0 | 48.7 | 199% | 1416 |
 |
| Yearly Statistics | |||||
| Year [+] | RHmin % | RHmax % | Mean % | σ | n |
| 2026 | 18.0 | 76.0 | 50.1 | 846% | 14560 |
| 2025 | 31.0 | 82.0 | 59.2 | 950% | 17337 |
| 2024 | 0.0 | 77.0 | 58.2 | 527% | 16257 |
Currently 84532 temperuture meausurements in the database.
|
| (c) Daniel Vindevåg 2004-2021 |
))
))
))
))
))
))