))
))
))
))
))
))
))
))
| Daily Statistics | |||||
| Day [+] | Tmin °C | Tmax °C | Mean °C | σ | n |
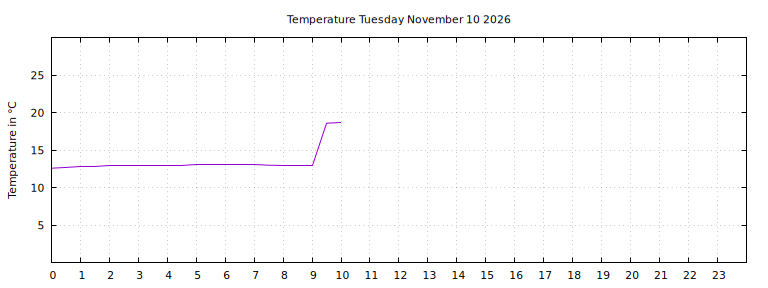
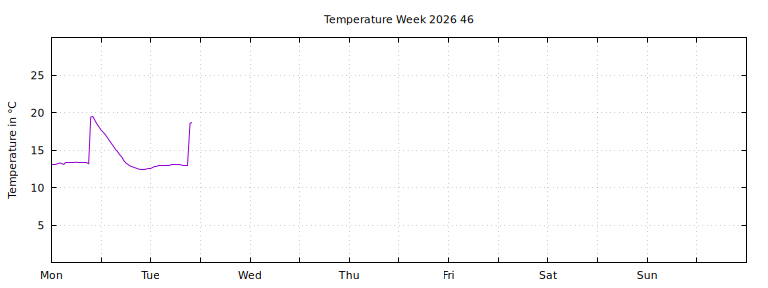
| Tuesday November 10th | 12.6 | 18.7 | 13.9 | 205% | 23 |
| Monday November 9th | 12.4 | 19.5 | 14.3 | 207% | 48 |
| Sunday November 8th | 12.9 | 22.3 | 15.2 | 270% | 48 |
| Saturday November 7th | 12.8 | 30.2 | 17.4 | 570% | 48 |
| Friday November 6th | 11.6 | 35.6 | 18.2 | 819% | 48 |
| Weekly Statistics | |||||
| Week [+] | Tmin °C | Tmax °C | Mean °C | σ | n |
| Week 46 (November 9th) | 12.4 | 19.5 | 14.2 | 207% | 71 |
| Week 45 (November 2nd) | 10.6 | 35.6 | 14.4 | 505% | 336 |
| Week 44 (October 27th) | 11.6 | 25.8 | 14.8 | 317% | 283 |
| Updated every 30:th minute. |
|
|
| Monthly Statistics | |||||
| Month [+] | Tmin °C | Tmax °C | Mean °C | σ | n |
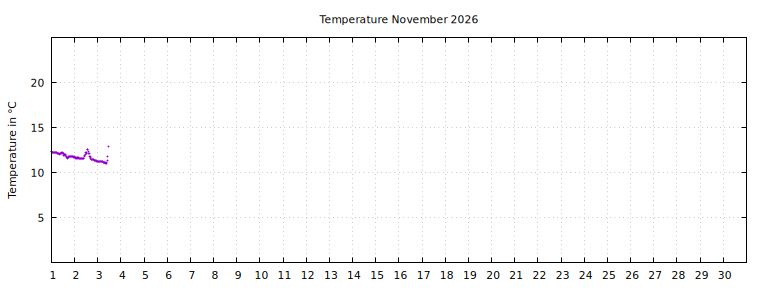
| November 2026 | 10.6 | 35.6 | 14.1 | 448% | 455 |
| October 2026 | 12.4 | 49.5 | 17.9 | 601% | 1241 |
| September 2026 | 14.4 | 52.9 | 20.1 | 729% | 1417 |
 |
| Yearly Statistics | |||||
| Year [+] | Tmin °C | Tmax °C | Mean °C | σ | n |
| 2026 | 4.6 | 60.9 | 17.3 | 1011% | 14417 |
| 2025 | 4.6 | 58.1 | 15.6 | 913% | 17347 |
| 2024 | 5.1 | 58.7 | 15.8 | 994% | 17245 |
Currently 335629 temperuture meausurements in the database.
|
| (c) Daniel Vindevåg 2004-2021 |
))
))
))
))
))
))